 |
| This is an isarithmic map. It shows a certain phenomenon defined by smooth and continuous lines. |
 |
| This is a choropleth map. It shows statistical data for predefined regions |
 |
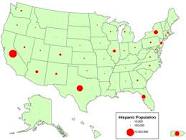
| This is a proportional symbol map. The different size symbols represent data relative to each location. |
 |
| This is a dot density map. A dot can represent a certain number range, and placed in a certain location to show that phenomenon. |
 |
| This is a map I created based on how rural or urban each county in Georgia is. |
No comments:
Post a Comment